The hiring, firing, coaching, motivating and development of employees is every manager's and every supervisor's number one job. How well they manage their people has a direct and unequivocal impact on their team's success.
| More Metrics This is the fourth article in a series in which MHM is reporting the results of the annual Census of Distribution research study.
|
Last fall, in partnership with The MPI Group (Cleveland) and Industry Insights (Columbus, Ohio), two industry and market research firms, MHM completed the first annual Census of Distribution. The survey asked a number of questions about human resource practices and performance.
While most of the 457 respondents reported no change in the number of employees working at their facilities in 2005 compared to the previous year, facilities in the Northeast and Midwest increased employment by a median of 3%. And there was significant growth in some circles. A quarter of respondents increased head count by 13.5% or more.
The number of full-time employees varied greatly depending upon the type of facility. Manufacturers reported a median of 100 full-time equivalent employees, which compares to 60 full-time employees for distributors, 26 for wholesalers, and 142 for retail distribution operations.
Only 13.4% of warehouse and distribution center managers reported that any of their employees were represented by a union. The median wage rate of union workers was 25% higher ($15 per hour) compared to non-union employees ($13 per hour). The median annual labor cost (including wages, taxes and benefits) of union workers was $47,800, which compares to $36,700 for non-union employees.
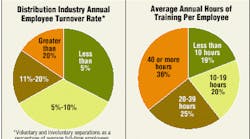
The median employee turnover (voluntary and involuntary separations as a percentage of average full-time employees) was 8%. Approximately one-fourth of facilities reported turnover of 15% or more. Manufacturers (2.6%) and distributors (1.0%) reported much lower median employee turnover rates than retail distribution operations (16%). The turnover rate was also lower at union facilities (5%) compared to non-union ones (8%). Turnover was highest in the South and West (10%) compared to other regions.
Constant training is one tactic facility managers can take to hold onto their human assets in a market increasingly hungry for skilled labor. Providing employ-ees with learning opportunities and upward career paths within the organization means they won't have to seek such opportunities elsewhere. Most Census of Distribution survey participants provide employees with at least 20 hours of training per year. Just over one third of facilities provide 40 hours of training or more annually.
Source: MHM 2005 Census of Distribution. See www.mhmonline.com/cod for more results and the complete research methodology.
The majority of warehouse and distribution facilities have established programs to productively manage and protect their workforce. Census of Distribution respondents believe their safety and health initiatives are their most effective HR programs. Leadership development and teaming programs are their least effective programs. ("N=" refers to the number of responses for each question.)
| Distribution Employee Costs | Mean | 25th percentile | Median | 75th percentile |
| Approximate wage for direct-labor employees (hourly rate without overtime) (N=399) | $13.08 | $10.25 | $12.26 | $15.00 |
| Total labor cost per direct-labor employee (wages, taxes, benefits, etc.) (N=310) | $40,960 | $31,200 | $37,440 | $46,800 |
| Employer-provided health-benefit costs as a percentage of total labor costs (N=294) | 19.8% | 10.0% | 18.0% | 27.0% |
| Health-benefit costs change over the past year (N=312) | 13.8% | 3.3% | 10.0% | 20.0% |
In addition to whether workers are unionized or not, wage rates and labor costs vary somewhat by region and industry. Manufacturing and distribution company employees earn more per hour (around $13) than wholesale or retail distribution employees (a little over $11 per hour). Over half of companies responding to the survey had to manage a 10% annual increase in health-benefit costs, and over one-fourth had to find ways to cope with a 20% increase in such costs. ("N=" refers to the number of responses for each metric.)


