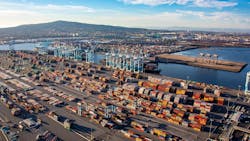
A record-setting 73 cargo ships anchored off of California’s Los Angeles and Long Beach last month made headlines, but port congestion at China’s largest ports underscores the scale of the situation.
According to project44 data, as of October 7, there were around 386 ships (anchored and moored) off Shanghai and Ningbo — two of China’s busiest ports, of which, 228 were cargo and 45 container vessels.
These numbers spell further product shortages, delays for businesses and consumers, against a backdrop of holiday sales and a global post-Covid recovery.
Containerized trade through Chinese ports accounts for 40% of global container trade and Shanghai is currently the world’s busiest container port with Ningbo the 3rd busiest container port in the world.
While these berthing delays are partially driven by lingering backlogs from the COVID-19 closure of Ningbo port, the impact of Typhoon Chanthu, and the current Golden Week between 1st and 7th October 2021, other factors are worsening the situation.
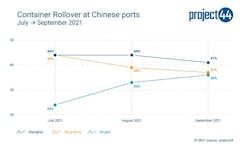
Container rollover rates, defined as the percentage of containers that miss their scheduled sailings, have stayed high, indicating that Chinese ports are not making significant headway in dealing with excess cargo.
At Ningbo, which was temporarily shut when a worker tested positive for COVID-19 in July, rollover rates are still rising, reaching 36% in September.
Although the ports of Hong Kong and Shanghai showed a slight reduction in the rollover rates, the total percentage still remains high at 41% and 37% respectively.
Moreover, businesses across China are facing a power-shortage crisis as Beijing has imposed strict rationing of electricity, forcing manufacturers to scale back just as demand heats up. Mandatory power limits and shortages of coal reserves are starting to affect global trade.
“We can expect these growing backlogs across Chinese manufacturers and ports to exacerbate imbalances at US and European ports” said project44’s VP of Supply Chain Insights Josh Brazil, likening the current situation to a “global whiplash effect.”“As it becomes increasingly hard to get inventory from factory floors to end-consumers, competition for shipping capacity will heat up,” said Brazil. “The only way to survive in a market like this is by being proactive with granular visibility into your shipments.”
“At this point, pretty much everybody is feeling the pain,” Brazil said. “The challenge is less about achieving full inventory -- that ship has sailed -- and more about adapting to, and planning for future disruption.”
Lead Times
Container lead times is the total transit time for a container/ship from the Port of Load till the Port of Discharge including the time spent at the various ports en route including time spent at anchorage at the wayports or at the destination port.
When there are cargo rollovers due to vessel space capacity, overbooking, blank sailings etc, additional costs will be incurred by way of port costs which contributes to the increase in freight rates.
The delays caused by cargo rollovers also affect production and delivery patterns at the destination ports as customers who have placed orders for raw materials for manufacturing or retail goods for consumers cannot get their goods in time.
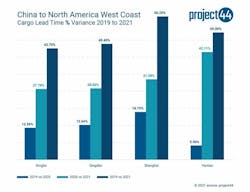
Insights generated by projected44’s real-time supply chain visibility platform show that the lead times for shipments from China to US West Coast have drastically increased in 2021 compared to 2020 and 2019.
As can be seen in the above charts,
- lead times from Yantian to the West Coast of North America increased by 9 days between 2019 and 2021 (34.85%).
- lead times from Shanghai and Qingdao increased by 9 days (36.39%) and 10 days (32.79%) respectively, to the main ports in the West Coast of North America.
“Orders are reaching customers with a delay of at least 10 days compared to 2019 pre-pandemic delivery times,” Brazil says
“Customers need to ensure that they allow enough time for the goods to move from Point A to Point B and to ensure that the cargo is cleared and delivered on time, ”Brazil added.


