All manufacturing plants have raw materials coming in and finished product going out,” said C.R. “Buzz” Canup, president of Canup & Associates, an Austin, Texas,-based site location firm whose varied list of clients have included Nissan, Volkswagen, Honda, Michelin and Sumitomo Sitex. “The quantities and methods of transportation may vary based on the type of product, but all manufacturing plants will be transportationand logistics-sensitive. The larger the volumes, the more sensitive the plant becomes.”
Canup speaks from experience. He has been heavily involved in a number of major auto assembly plant site searches during the past two decades. But huge auto assembly mega-plants, while more spectacular, represent just a tiny fraction of the market when it comes to new manufacturing plants. Still, they share one thing in common with smaller plants.
All manufacturing operations live or die based, in large part, on the strength and resiliency of their supporting logistics networks.
“Global competition requires that many companies maintain efficient and reliable supply chain networks,” said Don Schjeldahl, vice president and director of the Facilities Location Group, Austin Consulting, a Cleveland-based division of The Austin Co. “Distribution centers, one component of these networks, must perform without interruption and on cue to ensure corporate success.”
Lean manufacturing practices and just-in-time delivery of raw materials and supplies has had a tremendous impact on where manufacturers, and their suppliers, choose locations for their facilities.
“The easier it is to move goods in numerous directions and the faster you can serve your client, the greater chance of sustainability you will have over your competitor,” said Michelle Harris, a project consultant with CH2M Hill in Nashville, Tenn. “Many companies are implementing lean initiatives and just-in-time processes, which means suppliers and warehousing facilities providing their raw materials must be close and easily accessible.”
“The necessities of both “really just in time” production and time to market, now make logistics a vital part of any relocation decision,” said John Schuetz, executive vice president of Location Management Services, a global site location consulting firm based out of Mission Viejo, Calif.
Every siting project has requirements unique to the business model of the company, according to Harris. “Some companies choose to have interstate visibility for marketing purposes, others choose to be more secluded because of the nature of the products or emissions. Still others want multiple modes of transportation to reduce the risk or expense of relying on one particular mode of transportation or because of raw materials utilized.”
Above all else, though, logistics decisions are driven by the unique business requirements of that particular company.
For the past seven years, Expansion Management and Logistics Today magazines have partnered to produce what we call our annual Logistics Quotient™ ranking of the most logistics friendly cities in the United States.
As in years past, the study takes a look at the 362 metropolitan statistical areas (MSA) established by the Office of Management and Budget and compares them according to 10 major categories: the overall transportation & warehousing industry climate, work force/labor costs/availability/skill levels; road/highway basic infrastructure; road density and congestion; road and bridge conditions; interstate highway access (both main and auxiliary routes); fuel taxes & fees; railroad service; water ports (both river/ lake and ocean); and air cargo service.
A standard feature of Expansion Management’s various annual metro “Quotient” studies is the awarding of the “5-Star” designation to the top 20% of the MSAs. Metros that earn this distinction can consider themselves among the elite logistics cities.
Metros that rank in the 21 to 40 percentile are designated as “4-Star Logistics Metros,” while those that rank in the middle (41 to 60 percentile) are designated as “3-Star,” and so on.
New York led all states, with five MSAs receiving the “5-Star” designation, while California, Ohio and Tennessee each had four MSAs. Florida, Illinois, North Carolina, Pennsylvania, South Carolina and Texas each had three “5-Star Logistics Metros” (see page 40 for a list of the “5-Star Logistics Metros” and how they rate in each of the 10 major categories).
| Best Railroad Service 1. Chicago-Naperville-Joliet, Ill.-In d.-Wis. 2. New York-Newark-Edison, N.Y.-N.J.-Pa. 3. Philadelphia-Camden-Wilmington, Pa.-N.J.-Del.-Md. 4. Pittsburgh, Pa. 5. St. Louis, Mo.-Ill. 6. Buffalo-Cheektowaga-Tonawanda, N.Y. 7. Detroit-Warren-Livonia, Mich. 8. Minneapolis-St. Paul-Bloomington, Minn.-Wis. 9. Dallas-Fort Worth-Arlington, Texas 10. Portland-Vancouver-Beaverton, Ore.-Wash. Source: ALK Technologies Inc., Princeton, N.J. |
Transportation & Warehousing Industry
Unless your company provides its own shipping, it is important to take a close look at the transportation and warehousing (T&W) companies operating in each of the metro areas in which your company is considering locating.
“Transportation infrastructure is one of the key decision factors for manufacturers when they are doing site selection for a facility,” said Mary Faye LaFaver, Mid-Atlantic director of Ernst & Young’s business incentives and credits services practice. “The ease with which the company can move its products for global distribution, or to meet client demands for timely delivery may impact their operating costs, as well as potentially impact the quality of their customer service.”
What you should be looking at is the number of carriers that provide service in that metro area, as well as the number of T&W employees working in the metro. That will give you a general feel for what you can expect in terms of flexibility and competition. Beyond that, you’ll want to talk to each carrier specifically about prices, routes, LTL and other issues specific to your operation.
Once a particular metro area makes your final short list of potential locations, you should also talk with several companies that currently operate in that metro and use local carriers to ship raw materials in and finished goods out.
T&W Work Force
If your company is planning to set up a distribution center or other logistics operation and intends to hire a number of logistics workers, it is important to take a hard look at the T&W work force in each metro you’re considering.
“Availability of a reliable and hard working work force at reasonable wage rates are additional pillars of effective distribution operations,” said Schjeldahl.
Some areas you should focus on are the number of T&W employees by specific occupation, prevailing wage rates, productivity measurements and reliability indicators, such as work stoppages.
As with evaluating the T&W industry, once a particular metro area makes your short list of potential locations, you should also talk with several companies that currently operate in that metro to learn from their experiences in terms of the price, quality and reliability of the T&W work force.
Road Infrastructure
The key to evaluating the road infrastructure is to ensure that it is appropriate to the size and level of traffic for the metro area.
“Depending on the product being manufactured, the transportation infrastructure (roads, bridges, rail access) needs to be carefully examined,” said Ernst & Young’s LaFaver. “Large, wide, heavy loads may require additional costs for permits, pilot car service or road closures. Some loads may even be too tall or wide to be accommodated by bridges, overpasses or rail tunnels. If those considerations are not examined at the time the site selection is being made, it will negatively impact the startup and operating costs for the site later.”
Even once your company has decided upon a specific metro, the choice of specifically where to locate within that metro is a critical decision, particularly if you are planning a distribution center. “Transportation costs can vary significantly over a relatively short distance, so if a DC moves outside the center of gravity, distribution distances become greater and, therefore, transportation costs increase,” said Canup
Road Congestion
| Best Waterborne Commerce |
The goal is to identify and quantify traffic bottlenecks, both real and potential. Think orange barrels and 18-wheelers idling on overcrowded roads, belching fumes and burning fuel that comes straight off the bottom line, just like any other operating expense. “Transportation infrastructure is a central component of good communities,” said Schjeldahl. “This includes heavy duty roads, well designed traffic controls and separation of heavy truck traffic from residential neighborhoods.”
While the existence of a robust road infrastructure is critical, so too is the ability to traverse that system of roads in a timely manner. A 10-lane highway doesn’t do much good if the volume of traffic turns it into a parking lot.
Road & Bridge Condition
The collapse of an interstate highway bridge in Minneapolis earlier this year focused our attention on our nation’s crumbling transportation infrastructure. Whether we can maintain that focus long enough to do something about it is another question. “The existing quality of the transportation infrastructure also needs to be taken into consideration because it has long-term implications for the cost of doing business in that jurisdiction,” La- Faver said. “If the quality of the infrastructure is poor, there is the potential for future tax escalation or special assessments repair.”
Interstate Highways
Ready access to both north-south and east-west interstate highways is an important consideration when comparing potential metro areas.
| Best Air Cargo 1. Memphis, Tenn .-Miss.-Ark. 2. New York-Newark-Edison, N.Y.-N.J.-Pa. 3. Los Angeles-Long Beach-Santa Ana, Calif. 4. Miami-Fort Lauderdale-Miami Beach, Fla. 5. Chicago-Naperville-Joliet, Ill.-Ind.-Wis. 6. Dallas-Fort Worth-Arlington, Texas 7. Atlanta-Sandy Springs-Marietta, Ga. 8. Philadelphia-Camden-Wilmington, Pa.-N.J.-Del.-Md. 9. San Francisco-Oakland-Fremont, Calif. 10. Louisville, Ky.-Ind. Source: Federal Aviation Administration, Bureau of Transportation Statistics and the 2005 U.S. County Business Patterns |
“The second primary [logistics] driver is access to interstates with low congestion for traffic,” Canup said. “Access to interstates enables the movement of goods more quickly, safely, and at lower costs. Also important is the presence of interstate auxiliary routes, like bypasses and beltways/loops, because it provides an alternate route for much of the traffic simply transiting the metro.
Taxes & Fees
Another area to take a close look at are the various vehicle-related taxes and fees you will face in each of the various locations you are considering.
“Vehicle taxes and fees make a difference in the bottom line of the cost of moving goods,” said Michelle Harris of CH2M Hill.
Ulrich Schmidt, senior manager for strategic relocation and expansion services at KPMG LLP, agrees. “State and local tax is one of the top five site selection factors on virtually every project we work on,” Schmidt said. “Another issue often overlooked is inventory tax, which could be a significant cost item.”
It’s important to look at the full range of taxes and fees a particular state may levy.
“Different types of state and local taxes across locations obviously have variable impacts on similar types of projects, but can become an attractor or may drive projects away,” Canup said. “It is always critical to build a financial model to evaluate the impact of taxes on a direct comparative basis.”
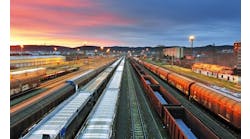
Railroad Service
For decades, rail was abandoned in favor of trucking for many manufacturing and distribution operations, according to Schjeldahl.
“During the past 15 years, we have seen increased use of rail across a broad spectrum of industries,” he said. “For example, [we worked on] a food processing client recently located in the North Carolina Piedmont region and a healthcare products manufacturing client located in eastern Tennessee, and for both projects rail was a deciding factor. Traffic congestion, high cost of fuel, driver shortages and better service by railroads all have contributed to this trend.” The need for rail access is usually directly related to the size and bulk of the raw materials and final product being produced. As a result, rail is not always a requirement but, according to Canup, when it is needed it can become the deal-maker or deal-breaker.
Waterborne Cargo
Like rail, water port access is not always a consideration but, when it is, it's generally a deal-breaker if it’s not accessible.
| Least Road Congestion 1. North Dakota 2. South Dakota 3. Montana 4. Wyoming 5. Alaska 6. Idaho 7. New Mexico 8. Iowa 9. Kansas 10. Nebraska Source: Federal Highway Administration, |
“I assisted a state recently in attempting to recruit the ThyssenKrupp steel mill to their location,” said Canup. “The project required significant port facilities for receiving raw material from Brazil, and river access for transporting raw materials to the plant. That requirement . . . narrowed the alternatives very quickly.”
Usually, the requirement for port facilities has an international element to it.
“Two projects we completed on behalf of our clients recently had port considerations,” said Ernst & Young’s LaFaver. “One project needed port facility for international export of a finished product that was large and cumbersome and did not lend itself to air transport. The other project needed a port facility for raw ore product that was imported from a variety of international locations, aggregated at the port facility and then shipped to the plant site.”
Some experts see the importance of access to water ports increasing as a logistics consideration over the next decade.
“With the completion of the Panama Super Canal due to be completed in 2014 . . . relieving the necessity of transcontinental shipping of products from currently overloaded West Coast ports, we expect to see waterborne logistics take on even a greater role in location decision-making,” LMS’ Schuetz said.
Air Cargo
| How We Eval uate the Logistics Infra structure Our annual logistics quotient™ compares all 362 metropolitan statistical areas according to the following 10 major categories. Transportation and Warehousing Industry. The number of establishments and the number of employees in the MSA in NAICS Code 48-49. Source is the U.S. Census Bureau’s “2005 County Business Patterns.” Transportation and Warehousing Work Force. The number of employees in the MSA, as well as the average salary, in NAICS Code 48-49. Source is the U.S. Census Bureau’s “2005 County Business Patterns.” Road Infrastructure. Miles of road per capita, total daily vehicle miles of travel (DVMT) per capita, freeway miles as a percentage of total road miles, percentage of DVMT served by freeway, and the average daily traffic per freeway lane. Source is the Federal Highway Administration, 2005. Road Congestion. Road congestion was determined based on the weighted average daily traffic per lane for interstate highways and principal arterial roads, both urban and rural. Source is the Federal Highway Administration, 2005. Road and Bridge Condition. Bridge condition was based on the percentage of bridges statewide that are functionally obsolete, as well as the percentage that were structurally deficient. Source is the Federal Highway Administration, 2006. Interstate Highways. Interstate highway access was based on the number of primary interstate highways serving the metro area, as well as the number of interstate auxiliary interstate routes. Source is the Federal Highway Administration, 2007. Transportation Taxes & Fees. Annual state and federal truck user fees, provided by the American Transportation Research Institute, 2005, and motor fuel excise tax rates as of Jan. 1, 2007, provided by the Federation of Tax Administrators. Railroad Service. Railroad service was determined by the number of rail carriers serving the metro area. The data came from ALK Technologies Inc. of Princeton, N.J. Waterborne Cargo Service. This category includes total tonnage for all ports located within the confines of the metro area and comes from the U.S. Army Corps of Engineers’ Waterborne Commerce Statistics Center. Air Cargo Service. This category includes the number of air courier companies, as well as the total air cargo tonnage for the metro. The data comes from the Federal Aviation Administration, the Bureau of Transportation Statistics, and the U.S. Census Bureau’s “2005 U.S. County Business Patterns.” |
As with rail and water, air cargo access is not always a consideration but, when it is, there’s no substitute.
“Air Cargo capability becomes a significant factor when dealing with highly valued items with a short shelf life or half life,” CH2M Hill’s Harris said. “This can be a requirement for R&D facilities, depending on the nature of the research.”
Computer manufacturing plants are another example of where air access is an important consideration. “Proximity to an air cargo hub was a definite location driver for Dell in locating manufacturing operations in Nashville initially and, subsequently, in the Greensboro/ Winston-Salem (N.C.) area,” Canup said. “Their lifeblood for product shipment is air freight.” There is ofan an international element that requires access to air cargo facilities.
A Few Last Words.
It is important to remember that the overall rankings represent the combined strength of an MSA in all categories. However, for your company’s purposes, perhaps not every category is important. That’s why you should look at a metro’s ranking in each category and assign your own weighting to that category based on its relative importance to your company.
When evaluating potential locations for a future manufacturing facility or distribution center, clearly not all metro areas, despite their size, offer the same logistics infrastructure to support your company.
It is more important to focus on how a particular metro area rates in the logistics categories that are important to your company’s operation.
After all, if your operation does not require overnight air cargo, it doesn’t really matter if FedEx or DHL operates a hub there. Granted, it doesn’t hurt, but it shouldn’t have a major influence on your final decision, either.
“Profit margins are impacted by the cost of logistics,” Schuetz said. “The ability to have the right mix of logistics infrastructure in place to support the targeted industry will be a major element in relocation decisions now, and more so in the future.”


