When the Spreadsheet Stops Scaling: How to Modernize Cyclical Logistics Across Industries
Key Highlights
- Slow refreshes, manual updates, and person-dependent processes signal that an operation may have outgrown its spreadsheet.
- A modern dashboard can surface current inventory, shipment status, and vendor shortfalls without manual data gathering.
- Rolling purchase orders and scheduled vendor updates automate repetitive work and make cyclical logistics more reliable.
- Geographic views and color-coded thresholds help teams spot pending receipts and inventory risks at a glance.
- These design principles apply across aviation, healthcare, retail, manufacturing, and logistics.

Somewhere in your organization, there is a spreadsheet holding things together that shouldn’t be. It was built for a smaller operation. Now it takes minutes to refresh, occasionally fails to load, and requires manual updates every cycle. Leadership lacks a clear operational view. When the person who built it leaves, institutional knowledge leaves with them.
This is not an aviation problem or a healthcare problem or a retail problem. It is an operations problem—and it shows up wherever cyclical logistics are managed at scale. The symptoms are consistent: manual vendor follow-ups, purchase orders updated by hand, no geographic visibility into where inventory actually is, and status checks that take far longer than they should.
The solution is also consistent. A recent transformation in airline in-flight entertainment (IFE) media logistics offers a clear blueprint, and the design principles translate to any supply chain managing cyclical vendor coordination.
Operations that Have Outgrown Their Tools
Most operational tracking systems start with what’s available—usually a spreadsheet connected to a database. At low volume, this works. As the operation grows, the tooling does not scale with it. Refresh times slow. Columns multiply until the dashboard is unreadable. The process becomes dependent on individuals rather than systems.
The failure modes are predictable. Vendor communication happens when someone remembers to initiate it. Purchase orders are updated by hand every cycle. Status checks that should take seconds take minutes. Nobody has a real-time picture of where things stand across the network.
This pattern appears in healthcare, where inventory managers track surgical supplies across multiple facilities without real-time visibility. It appears in retail, where replenishment teams manage cyclical restocking through trackers that cannot keep pace with transaction volume. It appears in manufacturing, where MRO teams discover that critical spare parts are in the wrong facility only after a line has gone down. And it appears in logistics and freight, where shipment status across a distributed network requires manual aggregation rather than a single live view.
In each case, the data exists. It is simply not surfaced in a way that enables fast, confident decisions.
A Case Study: In-Flight Entertainment Media Logistics
Airlines that use solid-state drives or digital transfer devices as aircraft parts operate a monthly logistics cycle that illustrates the problem clearly. Each month, a purchase order triggers a chain of events: drives ship from a vendor to stations across the network, get swapped onto aircraft, and the removed drives return to the vendor via repair order to be reloaded with the following month’s content.
At scale, across dozens of stations and hundreds of aircraft, this cycle requires precise tracking. Which drives go into which fleet? How many are in transit? Which stations have not received their shipment? How many drives are at the vendor, and is that enough to fulfill next month’s load?
The legacy system was a spreadsheet connected to a database. It took 10 to 15 minutes to refresh and often failed to load entirely. There was no visual hierarchy and no geographic view. Vendor communication happened once a month, when a purchasing manager remembered to follow up. Purchase orders were updated manually each cycle. Checking which stations were pending receipt of shipped drives took roughly 20 seconds per PO—manageable individually, but significant across an entire network.
The risks were real: drives arriving late, vendor shortfalls going undetected until a media load was at risk, and a process that worked only as well as the person running it.
Automation, Visualization, Proactive Communication
The redesign was built on one premise: If the data is already in the system, the team should not have to go looking for it. Information should surface automatically, in a format that makes the right action immediately obvious.
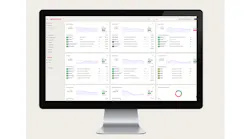
A modern business intelligence dashboard replaced the spreadsheet. It refreshes every hour of the day, ensuring decisions are based on current data. Charts and visual indicators replaced raw tables, giving stakeholders an immediate read on fleet status—quantities ordered, shipped and received by fleet type.
Rolling purchase orders eliminated the manual update cycle. Every 28 days, the dashboard automatically surfaces the active PO set. The current cycle is always current.
Automated vendor communication replaced ad hoc outreach. Every Friday, a workflow automation sends the vendor a structured update listing all drives pending induction for the upcoming month, on a predictable schedule.
A geographic map replaced the station-by-station status check. A live view highlights which stations are pending receipt of new drives—a check that previously took 20 seconds per PO now takes a second to scan. Drives in stores eligible to be cut on repair orders surface in the same view.
Color-coded vendor inventory thresholds made shortfalls visible immediately. Green means the vendor has sufficient drives for the current cycle. Red means drives need to be returned to close the gap. The count appears alongside the indicator, so the team knows both the status and the magnitude.
What This Looks Like Across Industries
The specific elements—drives, repair orders, fleet types—are aviation-specific. The design principles are not.
In healthcare, the same dashboard logic addresses consumable inventory across facilities. Automated PO rolling handles replenishment for surgical supplies and pharmaceuticals. Color-coded indicators flag at-risk locations before a shortage becomes a clinical problem.
In retail and e-commerce, the geographic map translates to distribution center visibility. A rolling cycle dashboard surfacing shortfalls by location applies the same logic to a warehouse floor.
In manufacturing MRO, a live view of stock levels by site, with thresholds tied to production needs, gives maintenance teams the visibility to prevent downtime rather than discover a gap after the line has stopped.
In logistics and freight, an automatically refreshing geographic status view that surfaces pending receipts is the same solution applied to packages or pallets rather than media drives.
The underlying capabilities—automated refresh, rolling cycle logic, workflow-driven vendor communication, geographic visibility, threshold-based alerts—are not industry-specific. They are infrastructure for making operational data usable at any scale.
How to Find This in Your Own Operation
The tools I used were already licensed and supported where I work. The platform matters less than the pattern. Look for these signals in your own operation:
• A refresh cycle slower than your decision cycle. If people are waiting for data to load before they can act, the tool is behind the operation it’s supposed to support.
• A recurring communication that depends on someone remembering. Anything sent ‘whenever it became critical’ instead of on a fixed schedule is a candidate for automation.
• A manual reset that repeats every cycle. If a purchase order, report, or tracker gets rebuilt by hand every month, that’s repeatable logic, not real work.
• A status check that requires asking a person instead of looking at a screen. That usually means the data exists somewhere; it just isn’t surfaced yet.
• A threshold nobody sees until it’s already a problem. If “we're running low” is something a person notices instead of something the system flags, build the alert before you need it.
Recognizing When the Operation Has Grown Past the Spreadsheet
The spreadsheet is not the enemy. It is the right tool for a certain scale of operation. The problem is recognizing when the operation has grown past it—and when the team is spending more time maintaining the tracker than acting on what it tells them.
The pattern that emerges when you cross that threshold is the same regardless of industry: manual steps where automation is possible, data that exists but is not surfaced, and vendor relationships managed by memory rather than system. The fix is also the same: identify the friction points, automate the routine steps, and build visibility that makes the right action obvious without requiring someone to assemble the picture first.
The blueprint applies wherever cyclical logistics meets vendor coordination. The industry does not matter. The pattern does.
About the Author
 Kshitiz Saini
commodity manager
Kshitiz Saini is a commodity manager at American Airlines, one of the world's largest airlines, specializing in sourcing, logistics automation, operational visibility, and process transformation within complex asset-intensive environments. His work focuses on improving supplier coordination, inventory tracking, and decision-making through automation and data-driven operational systems.
Related
 How to Scale Circular Supply Chains