Supply Chain Design Data Visualization [New Products]
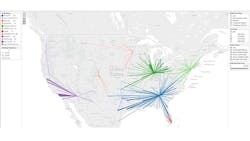
INSIGHT Inc. has introduced a data analysis and visualization module for SAILS, a strategic supply chain design software suite. The new offering, entitled the SAILS Data Visualization Module, distills the essence of large, complex strategic supply chains into just a few tables that make it easy to display maps, graphical results or hierarchical relationships.
The new data export facility makes it easier to exploit the power of familiar third-party tools such as: Tableau Software and Microsoft Excel 2013.
INSIGHT’s new capability enables users to probe complex questions more quickly and intuitively. Setup is quick, does not require IT support and provides access to data such as:
• Total System Metrics.
• Commodity Metrics.
• Procurement analysis at the supplier and raw material level.
• Manufacturing analysis at the facility, line and product level.
• Distribution analysis at the facility and product level.
• Transportation analysis at the lane and product level.
• Product and customer segment flow path analysis.
The SAILS Data Visualization Module is able to examine in detail model inputs as well as outputs.
